Retrieval-Augmented Generation (RAG) has transformed how we interact with Large Language Models (LLMs). By allowing models to pull in external information, RAG makes them more factual, up-to-date, and trustworthy. A particularly powerful approach is graph-based RAG, where knowledge is organized into a structured knowledge graph (KG)—a web of interconnected facts—that helps LLMs perform complex reasoning.
But there’s a hidden problem in how we build these graphs, a fundamental disconnect that has held back their true potential.
Today, we’re excited to introduce AutoGraph-R1, a new framework from our research that tackles this problem head-on. Published in our recent paper, “AutoGraph-R1: End-to-End Reinforcement Learning for Knowledge Graph Construction,” our work represents a paradigm shift: from building graphs that are merely “good” on paper to building graphs that are demonstrably “useful” in practice.
The Great Disconnect: Why a “Good” Graph Can Be a Bad Tool
The standard way to create a KG for a RAG system is a two-step process:
- Construction: An LLM reads through documents and extracts facts (like
(Subject, Relation, Object)), which are then assembled into a graph. This graph is judged on “intrinsic” metrics like factual precision and recall. - Application: This static, pre-built graph is handed over to a RAG system to help answer user questions.
The problem? A graph that scores high on intrinsic metrics isn’t always useful for answering real-world questions.
Imagine you ask: “What is the government of the state where the Golden Gate Bridge’s city is?”
A standard, fact-focused graph builder might create a chain of facts like this:
(Golden Gate Bridge, connects, San Francisco)(San Francisco, is the center of, Northern California)(Northern California, is in, California)(California, has government, Republic)
This graph is factually correct, but the reasoning path is long and fragile. A retriever might get lost trying to traverse four hops and fail to find the answer.
What if the graph was built differently?
(Golden Gate Bridge, is located in, California)(California, has government, Republic)
This graph is simpler, more direct, and far more useful. The retriever can now find the answer in just two hops. This is the core idea behind AutoGraph-R1: we teach the graph builder to create these useful, optimized structures.
The Solution: Learning from the Final Exam
So, how do we bridge this gap? The challenge is that graph construction is a discrete process, making it impossible to use standard deep learning methods (like backpropagation) to send a “success signal” from the final question-answering task all the way back to the graph builder.
Our solution is Reinforcement Learning (RL).
Think of it like training a student. You don’t just grade them on how well they memorize flashcards (intrinsic quality). You grade them on how well they perform on the final exam (downstream task).
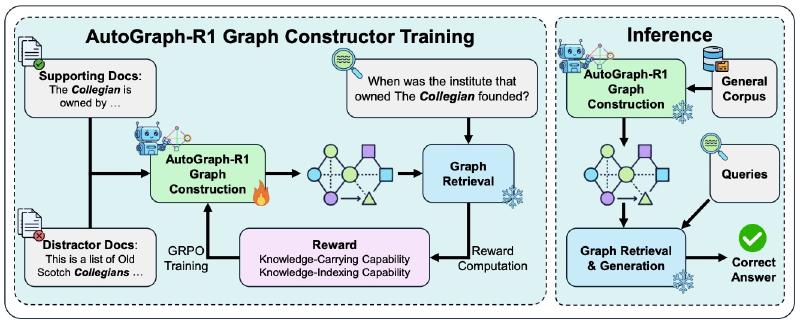
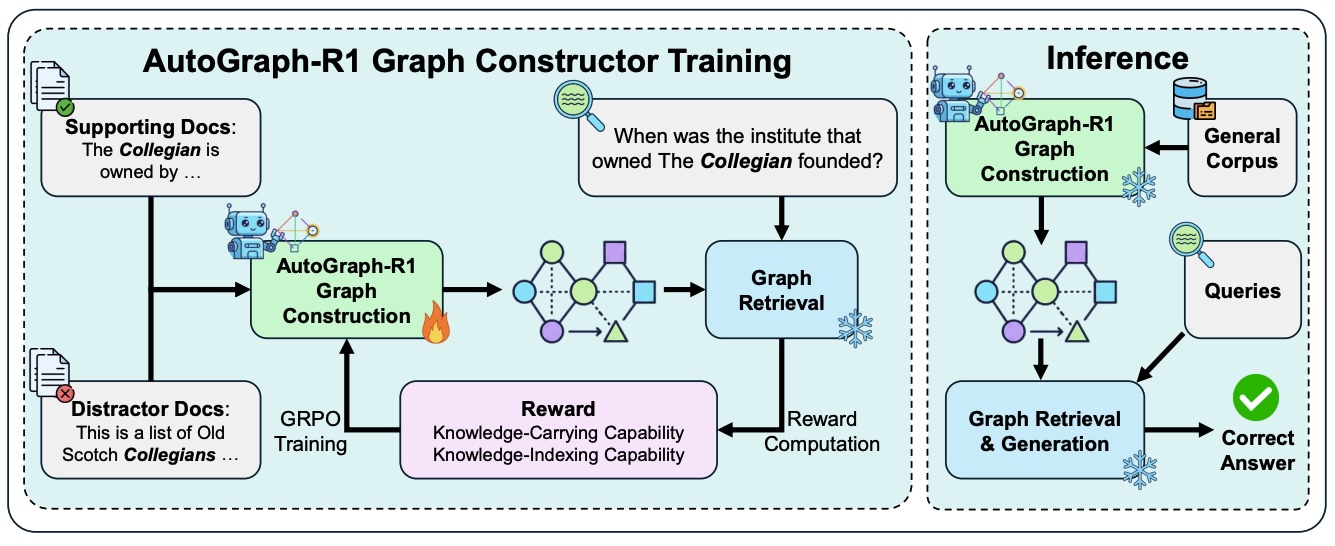
AutoGraph-R1 sets up a training loop where an LLM-based graph constructor learns through trial and error:
- Construct: The constructor model reads source documents and builds a knowledge graph.
- Test: A frozen, off-the-shelf RAG system immediately uses this graph to try and answer a question.
- Reward: The system gets a “reward” based on how useful the graph was for the task.
- Learn: Using this reward signal, the constructor updates its strategy (its policy) to build a better, more useful graph next time.
This “end-to-end” optimization closes the loop between construction and application, forcing the constructor to learn what a “useful” graph actually looks like.
Designing a “Reward” for Usefulness
A key innovation in AutoGraph-R1 is designing reward functions that capture a graph’s utility. We developed two task-aware rewards tailored to how the graph is used:
- Knowledge-Carrying Reward (RC): For when the graph itself is the knowledge source. The reward is simple: after retrieving a subgraph, can the answer be directly deduced from the facts within it? This teaches the model to create graphs that are informationally complete.
- Knowledge-Indexing Reward (RI): For when the graph acts as an index to find relevant text passages. The reward measures retrieval quality: how many of the correct “gold” passages did the graph help us find? This teaches the model to build a clean, high-fidelity index that connects related documents effectively.
Critically, our experiments showed that these specific, functional rewards are far more stable and effective than using a noisy, high-level signal like the final answer’s F1 score.
The Results: Demonstrably More Useful Graphs
We put AutoGraph-R1 to the test across five challenging question-answering benchmarks, using models from the Qwen and Llama families. The results were clear and consistent.
- Significant Performance Gains: KGs built by AutoGraph-R1 enabled state-of-the-art RAG methods to achieve significant F1 score improvements over graphs built with the same models in a standard, task-agnostic way. For some models and tasks, we saw average F1 gains of over +9 points.
- Better Indexing: When used as a knowledge index, our graphs led to much better retrieval. For example, with the Llama-1B model, passage recall improved by over +15 points, proving our framework creates a more effective “map” to the underlying knowledge.
- Utility and Quality Go Hand-in-Hand: Interestingly, optimizing for downstream utility didn’t come at the cost of factual accuracy. In fact, it improved it! The graphs built by AutoGraph-R1 had higher intrinsic precision and recall, showing that the pressure to be useful also encourages the model to be more accurate.
A Real-World Example
Let’s look at a concrete case from the 2WikiMultihopQA dataset.
Question: Who is the child of the director of the film Los Pagares De Mendieta?
- Standard KG: The baseline model correctly extracted
(Los Pagares de Mendieta, directed by, Leopoldo Torres Ríos)but failed to extract the director’s relationship to his child. The reasoning path was broken, and the system failed. - AutoGraph-R1 KG: Our RL-trained model learned that connecting people across relationships is crucial for multi-hop questions. It successfully extracted both
(Los Pagares de Mendieta, directed by, Leopoldo Torres Ríos)AND(Leopoldo Torres Ríos, father of, Leopoldo Torre Nilsson). The path was complete, and the system answered correctly.
The Big Picture
AutoGraph-R1 is the first framework to use reinforcement learning to directly optimize the KG construction process itself for downstream performance. Our work demonstrates that by closing the loop between how a knowledge base is built and how it’s used, we can create AI systems that are not just more knowledgeable, but fundamentally more capable.
We are moving from an era of building intrinsically “good” graphs to one of building demonstrably “useful” ones—and that makes all the difference.
Want to dive deeper?
- Read the full paper on arXiv: https://arxiv.org/pdf/2510.15339
- We believe in open and reproducible research. We have released our source code https://github.com/HKUST-KnowComp/AutoGraph-R1 and chechpoints https://huggingface.co/collections/gzone0111/autograph-r1.
中文版
检索增强生成(RAG)已经彻底改变了我们与大语言模型(LLM)交互的方式。通过允许模型引入外部信息,RAG使模型更加准确、更新及时且值得信赖。其中,基于图RAG是一种特别强大的方法,将知识组织成结构化的知识图谱(KG)来帮助LLM执行复杂的推理。
但在我们构建这些图谱的方式中,存在一个隐藏的问题,一个根本性的脱节阻碍了它们真正的潜力。
今天,我们很高兴向大家介绍AutoGraph-R1,这是我们研究中提出的一个新框架,它正面解决了这个问题。在我们最近的论文《AutoGraph-R1: End-to-End Reinforcement Learning for Knowledge Graph Construction》中,我们的工作展示如何从构建在纸面上"看起来不错"的图谱,到构建在实践中"确实有用"的图谱。
脱节:为什么一个"好"的图可能是一个坏的工具
为标准RAG系统创建知识图谱的标准方法是两步过程:
- 构建: LLM阅读文档并提取事实(如
(主语,关系,宾语)),然后将其组装成图谱。该图谱根据"内在"指标(如事实精确度和召回率)进行评判。 - 应用: 这个静态的、预先构建的图谱被移交给RAG系统以帮助回答用户问题。
问题在于?在内在指标上得分很高的图谱对于回答现实世界的问题并不总是有用的。
想象你问:“金门大桥所在城市属于的州政府的组织形式是什么?”
一个标准的、以事实为中心的图谱构建器可能会创建这样的事实链:
(金门大桥, 连接, 旧金山)(旧金山, 是中心, 北加州)(北加州, 位于, 加利福尼亚州)(加利福尼亚州, 政府形式, 共和制)
这个图谱在事实上是正确的,但推理路径长且脆弱。检索器可能在试图遍历四跳时迷失方向,无法找到答案。
如果图谱的构建方式不同呢?
(金门大桥, 位于, 加利福尼亚州)(加利福尼亚州, 政府形式, 共和制)
这个图谱更简单、更直接,也更加有用。检索器现在可以仅用两跳就找到答案。这就是AutoGraph-R1的核心思想:我们教图谱构建器创建这些有用的、优化的结构。
解决方案:从最终考试中学习
那么,我们如何弥合这一差距?挑战在于图谱构建是一个离散的过程,这使得不可能使用标准的深度学习方法(如反向传播)将"成功信号"从最终的问题回答任务一直传回到图谱构建器。
我们的解决方案是强化学习(RL)。
把它想象成训练学生。你不是仅仅根据他们如何记忆抽认卡(内在质量)给他们打分。你根据他们在期末考试(下游任务)上的表现给他们打分。
AutoGraph-R1设置了一个训练循环,其中基于LLM的图谱构建器通过试错学习:
- 构建: 构建模型阅读源文档并构建知识图谱。
- 测试: 一个冻结的、现成的RAG系统立即使用这个图谱尝试回答问题。
- 奖励: 系统根据图谱对任务的有用性获得"奖励"。
- 学习: 使用这个奖励信号,构建器更新其策略(其策略)以下次构建更好、更有用的图谱。
这种"端到端"优化闭合了构建和应用之间的循环,迫使构建器学习"有用"的图谱实际上是什么样子。
设计"有用性"的"奖励"
AutoGraph-R1的一个关键创新是设计捕获图谱效用的奖励函数。我们开发了两种针对图谱使用方式的特定任务奖励:
- 知识承载奖励(RC): 适用于图谱本身是知识源的情况。奖励很简单:在检索子图后,答案能否直接从其中的事实推断?这教会模型创建信息完整的图谱。
- 知识索引奖励(RI): 适用于图谱充当索引以查找相关文本段落的情况。奖励衡量检索质量:图谱帮助我们找到了多少个正确的"黄金"段落?这教会模型构建一个干净、高保真的索引,有效连接相关文档。
重要的是,我们的实验表明,这些特定的、功能性的奖励比使用嘈杂的、高层次的信号(如最终答案的F1分数)要稳定和有效得多。
结果:显著更有用的图谱
我们在五个具有挑战性的问题回答基准测试中对AutoGraph-R1进行了测试,使用来自Qwen和Llama系列的模型。结果清晰一致。
- 显著的性能提升: 由AutoGraph-R1构建的知识图谱使最先进的RAG方法相对于标准、任务无关方式构建的图谱实现了显著的F1分数提高。对于某些模型和任务,我们看到平均F1提高了超过+9分。
- 更好的索引: 当用作知识索引时,我们的图谱带来了更好的检索效果。例如,使用Llama-1B模型,段落召回率提高了超过+15分,证明我们的框架创建了一个更有效的"地图"来访问底层知识。
- 效用与质量并驾齐驱: 有趣的是,优化下游效用并不以事实准确性为代价。实际上,它提高了准确性!由AutoGraph-R1构建的图谱具有更高的内在精确度和召回率,这表明有用的压力也鼓励模型更加准确。
真实世界的例子
让我们看看2WikiMultihopQA数据集中的一个具体案例。
问题: 《Los Pagares de Mendieta》这部电影的导演的孩子是谁?
- 标准知识图谱: 基线模型正确提取了
(Los Pagares de Mendieta, 由...执导, Leopoldo Torres Ríos),但未能提取导演与其孩子的关系。推理路径被破坏,系统失败。 - AutoGraph-R1知识图谱: 我们的RL训练模型学会了连接人们的跨关系对于多跳问题至关重要。它成功提取了
(Los Pagares de Mendieta, 由...执导, Leopoldo Torres Ríos)和(Leopoldo Torres Ríos, ...的父亲, Leopoldo Torre Nilsson)。路径完整,系统正确回答。
大局观
AutoGraph-R1是第一个使用强化学习直接优化知识图谱构建过程以提高下游性能的框架。我们的工作表明,通过闭合知识库的构建方式和使用方式之间的循环,我们可以创建不仅更有知识,而且从根本上更强大的AI系统。
我们正在从构建内在"好"的图谱的时代转向构建确实"有用"的图谱的时代——而这使一切变得不同。
想要深入了解?
- 阅读arXiv上的完整论文:https://arxiv.org/pdf/2510.15339
- 我们相信开放和可重现的研究。我们已经发布了源代码 https://github.com/HKUST-KnowComp/AutoGraph-R1 和检查点 https://huggingface.co/collections/gzone0111/autograph-r1。